Figure 2d (Rong, Frey et. al. 2024)#
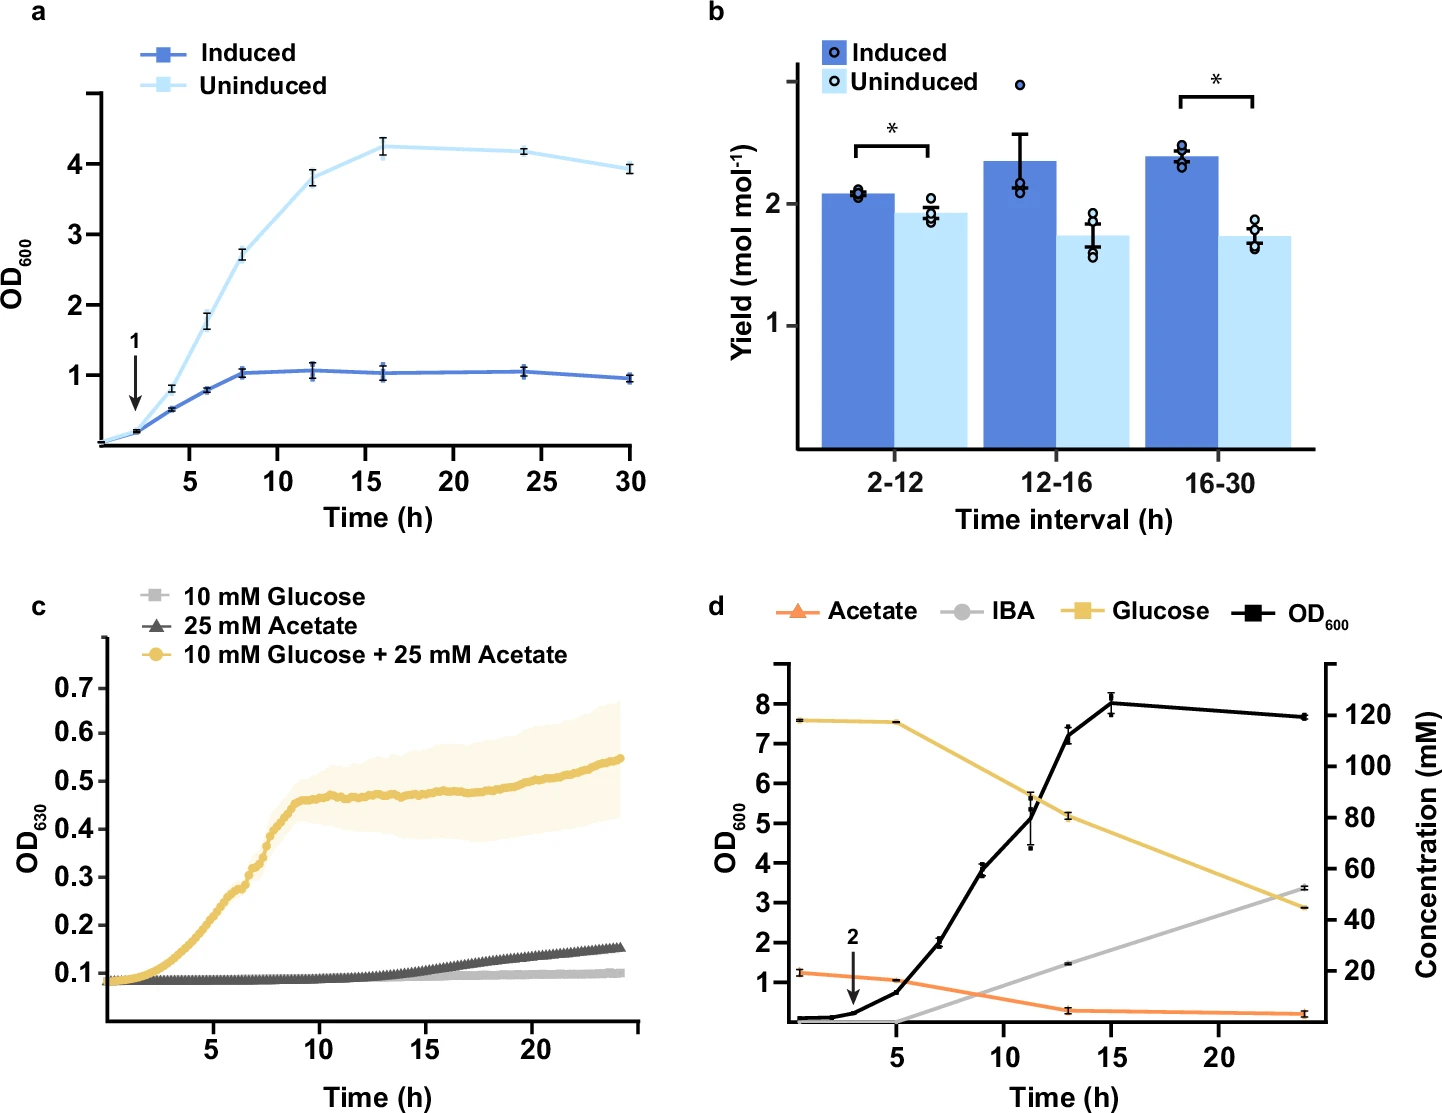 Caption: “Growth curve of the xylitol strain with (dark blue)
or without (light blue) the CRISPRi switch induced. (…) Error bars and shaded
areas indicate mean ± s.d. (n = 4 biological replicates (…)
OD values (…) were measured using a Jenway 6705 UV/Vis spectrophotometer (…)”
Caption: “Growth curve of the xylitol strain with (dark blue)
or without (light blue) the CRISPRi switch induced. (…) Error bars and shaded
areas indicate mean ± s.d. (n = 4 biological replicates (…)
OD values (…) were measured using a Jenway 6705 UV/Vis spectrophotometer (…)”
import matplotlib.pyplot as plt
import pandas as pd
import seaborn as sns
from numpy import nan
For protability the data is directly included as a dictionary. See the commented out code how the data was obtained from the CSV file figure_2d.csv.
| condition | IBA strain - OD600 | Glucose (mM) | Acetate (mM) | IBA (mM) | ||||||||
|---|---|---|---|---|---|---|---|---|---|---|---|---|
| replicate | R1 | R2 | R3 | R1 | R2 | R3 | R1 | R2 | R3 | R1 | R2 | R3 |
| time (h) | ||||||||||||
| 0.50 | 0.103 | 0.100 | 0.097 | 117.611111 | 118.111111 | 118.277778 | 18.333333 | 20.833333 | 18.833333 | 0.000000 | 0.000000 | 0.000000 |
| 2.00 | 0.116 | 0.111 | 0.117 | NaN | NaN | NaN | NaN | NaN | NaN | NaN | NaN | NaN |
| 3.00 | 0.230 | 0.220 | 0.216 | NaN | NaN | NaN | NaN | NaN | NaN | NaN | NaN | NaN |
| 5.00 | 0.750 | 0.740 | 0.740 | 117.388889 | 117.500000 | 117.166667 | 16.166667 | 16.666667 | 16.500000 | 0.000000 | 0.000000 | 0.000000 |
| 7.00 | 2.100 | 2.020 | 1.890 | NaN | NaN | NaN | NaN | NaN | NaN | NaN | NaN | NaN |
| 9.00 | 3.970 | 3.840 | 3.670 | NaN | NaN | NaN | NaN | NaN | NaN | NaN | NaN | NaN |
| 11.25 | 5.630 | 4.370 | 5.350 | NaN | NaN | NaN | NaN | NaN | NaN | NaN | NaN | NaN |
| 13.00 | 7.430 | 7.140 | 7.030 | 79.055556 | 81.277778 | 81.555556 | 3.500000 | 5.833333 | 4.166667 | 23.261674 | 22.789010 | 22.506725 |
| 15.00 | 8.200 | 8.140 | 7.720 | NaN | NaN | NaN | NaN | NaN | NaN | NaN | NaN | NaN |
| 24.00 | 7.720 | 7.630 | 7.650 | 44.666667 | 44.666667 | 44.944444 | 4.500000 | 2.000000 | 3.000000 | 53.367722 | 51.956295 | 52.087591 |
| 27.50 | 7.360 | 7.780 | 7.720 | NaN | NaN | NaN | NaN | NaN | NaN | NaN | NaN | NaN |
You will need to operate on a multi-index DataFrame.
#