4.7 Exploratory Data Analysis
In this section we do not perform statistical tests. The goal is quality control: check count distributions, detect technical outliers, and confirm that samples cluster as expected by condition before committing to differential expression analysis.
4.7.1 Estimate Size Factors
Library sizes (total mapped reads) differ between samples due to technical variation in sequencing depth. DESeq2's median-of-ratios normalisation corrects for this by computing a size factor per sample. Size factors close to 1.0 indicate balanced libraries; values far from 1.0 suggest uneven sequencing depth and warrant investigation.
dds <- estimateSizeFactors(dds)

sizeFactors(dds) %>%
  enframe(name = "sample", value = "size_factor") %>%
  kable(digits = 3, caption = "DESeq2 size factors per sample") %>%
kable_styling(bootstrap_options = c("striped", "hover"), full_width = FALSE)| sample | size_factor |
|---|---|
| C1 | 0.680 |
| C2 | 0.584 |
| C3 | 2.324 |
| sac1 | 0.977 |
| sac2 | 0.877 |
| sac3 | 1.275 |
4.7.2 Distribution of Normalised Counts
Boxplots of log2-normalised counts per sample provide a quick visual check that all samples have comparable expression distributions. After normalisation, boxes should overlap substantially. A sample that is a clear outlier in median or spread may indicate a failed library or mislabelled condition.
📌 Remember: These normalised counts are for visualisation only. Always feed DESeq2 raw integer counts.
cols_condition <- c("control"   = "#2c7bb6",
                    "treatment" = "#d7191c")

normalized_counts <- counts(dds, normalized = TRUE)

counts_norm <- reshape2::melt(
  normalized_counts,
  varnames   = c("gene_id", "sample"),
  value.name = "counts"
)

counts_norm <- inner_join(
  counts_norm,
  as.data.frame(colData(dds)),
  by = "sample"
)

dir.create(file.path(git_root, "results", "plots"), recursive = TRUE, showWarnings = FALSE)

distribution <- ggplot(counts_norm,
                       aes(x    = sample,
                           y    = log2(counts + 1),
                           fill = condition)) +
  geom_boxplot(outlier.size = 0.3, alpha = 0.8) +
  coord_flip() +
  theme_pubr(border = TRUE) +
  xlab("Sample") +
  ylab("log2(normalised counts + 1)") +
  ggtitle("Normalised count distribution — E. coli MG1655") +
  scale_fill_manual(values = cols_condition)

distribution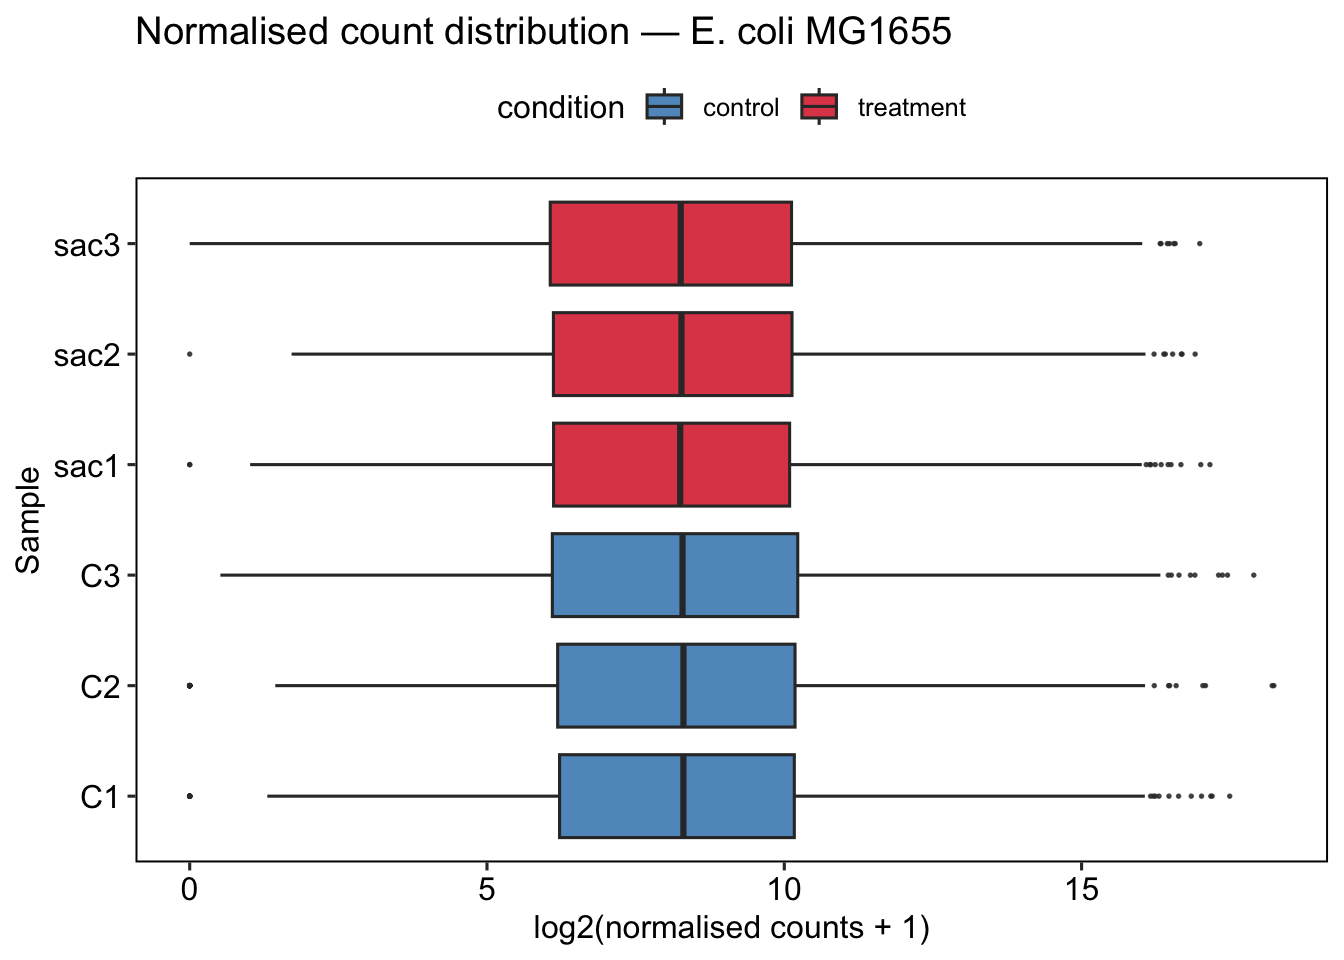
ggsave(
  filename = file.path(git_root, "results", "plots", "normalised_count_distribution.png"),
  plot     = distribution,
  width    = 8,
  height   = 6,
  dpi      = 300
)
💡 Extra: You can always use plotly!
C3 had a size factor of 2.324 — nearly 4x higher than C2 (0.584). Before normalization, C3 raw counts were inflated. After DESeq2’s median-of-ratios normalization, all samples align. This is why you never skip the normalization check, and why raw counts must go into DESeq2 rather than pre-normalized values.