4.8 Sample Correlation Heatmap
Euclidean distances between VST-transformed samples reveal how similar samples are to each other globally. Replicates from the same condition should cluster together and show small (dark) distances. A sample that is more similar to the opposite condition than to its own replicates is a red flag for a labelling error or a failed experiment.
Variance-stabilising transformation (VST) is applied here because raw or normalised counts have heteroscedastic variance (high-count genes have much larger absolute variance).
VST removes this mean–variance dependence, making distances meaningful across the full expression range (Anders & Huber, 2010).
blind = TRUE,the VST is computed ignoring the experimental design. This is recommended for QC and exploratory analysis, where you want an unbiased view of sample similarity.
Use blind = FALSE only when the transformation is feeding into a model that already accounts for the design.
sampleDists      <- dist(t(assay(vsd)))
sampleDistMatrix <- as.matrix(sampleDists)

rownames(sampleDistMatrix) <- paste(vsd$sample, vsd$condition, sep = " | ")
colnames(sampleDistMatrix) <- rownames(sampleDistMatrix)

colours <- colorRampPalette(rev(brewer.pal(9, "Blues")))(255)

heat <- pheatmap(
  sampleDistMatrix,
  col          = colours,
  border_color = NA,
  main         = "Sample-to-sample distances (VST) — E. coli MG1655",
  fontsize     = 10
)

heat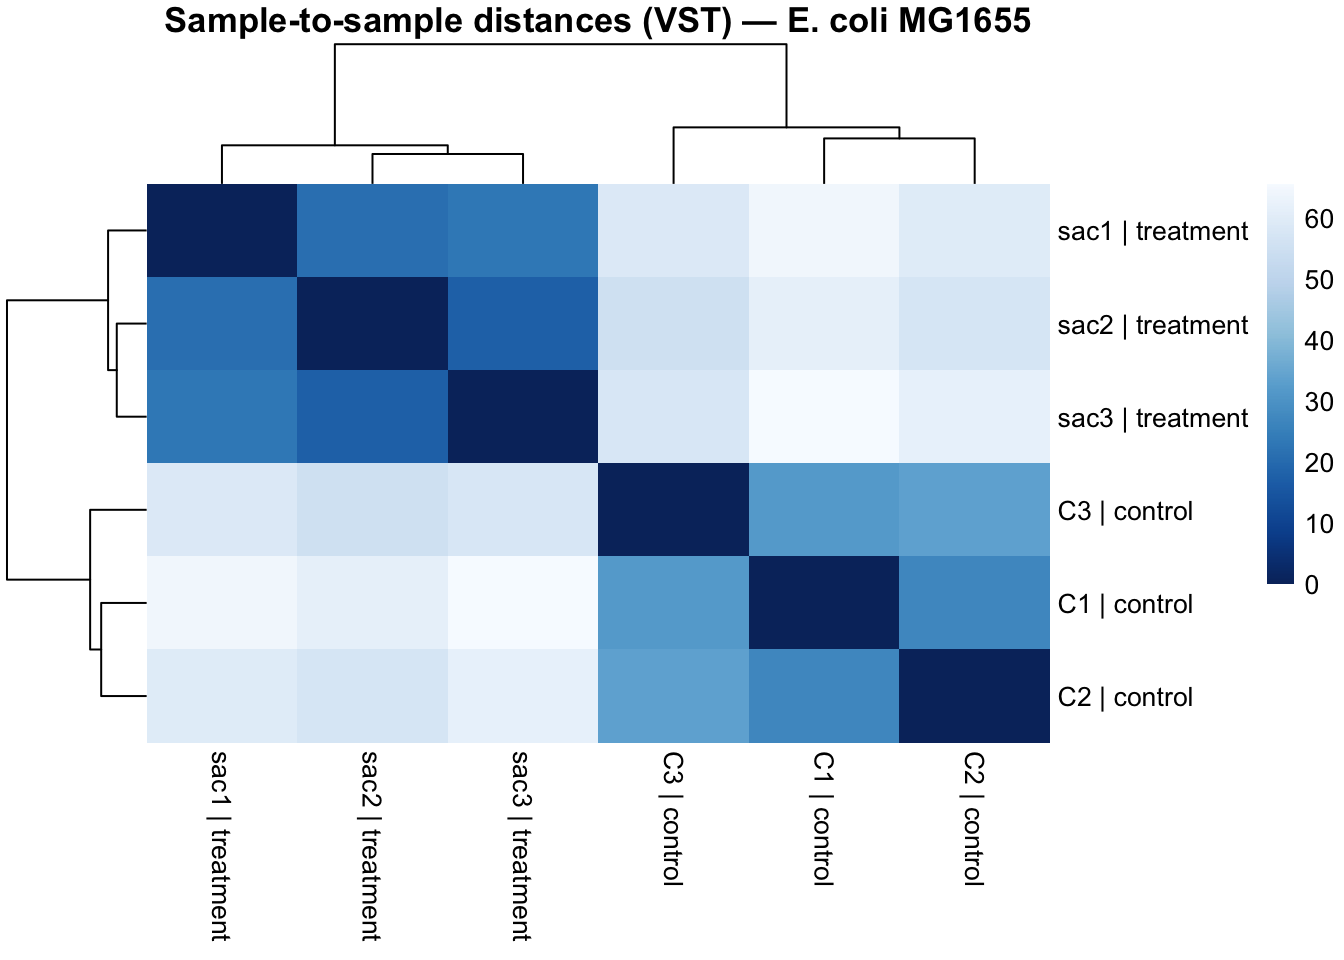
ggsave(
  filename = file.path(git_root, "results", "plots", "heat.png"),
  plot     = heat,
  width    = 8,
  height   = 12,
  dpi      = 300
)
The diagonal is always zero (a sample compared to itself). Dark = similar, light = distant. You want dark blocks on the diagonal within conditions and light blocks between conditions. If a replicate appeared in the wrong block, you would stop and investigate before running DESeq2.