5.6 MA Plot
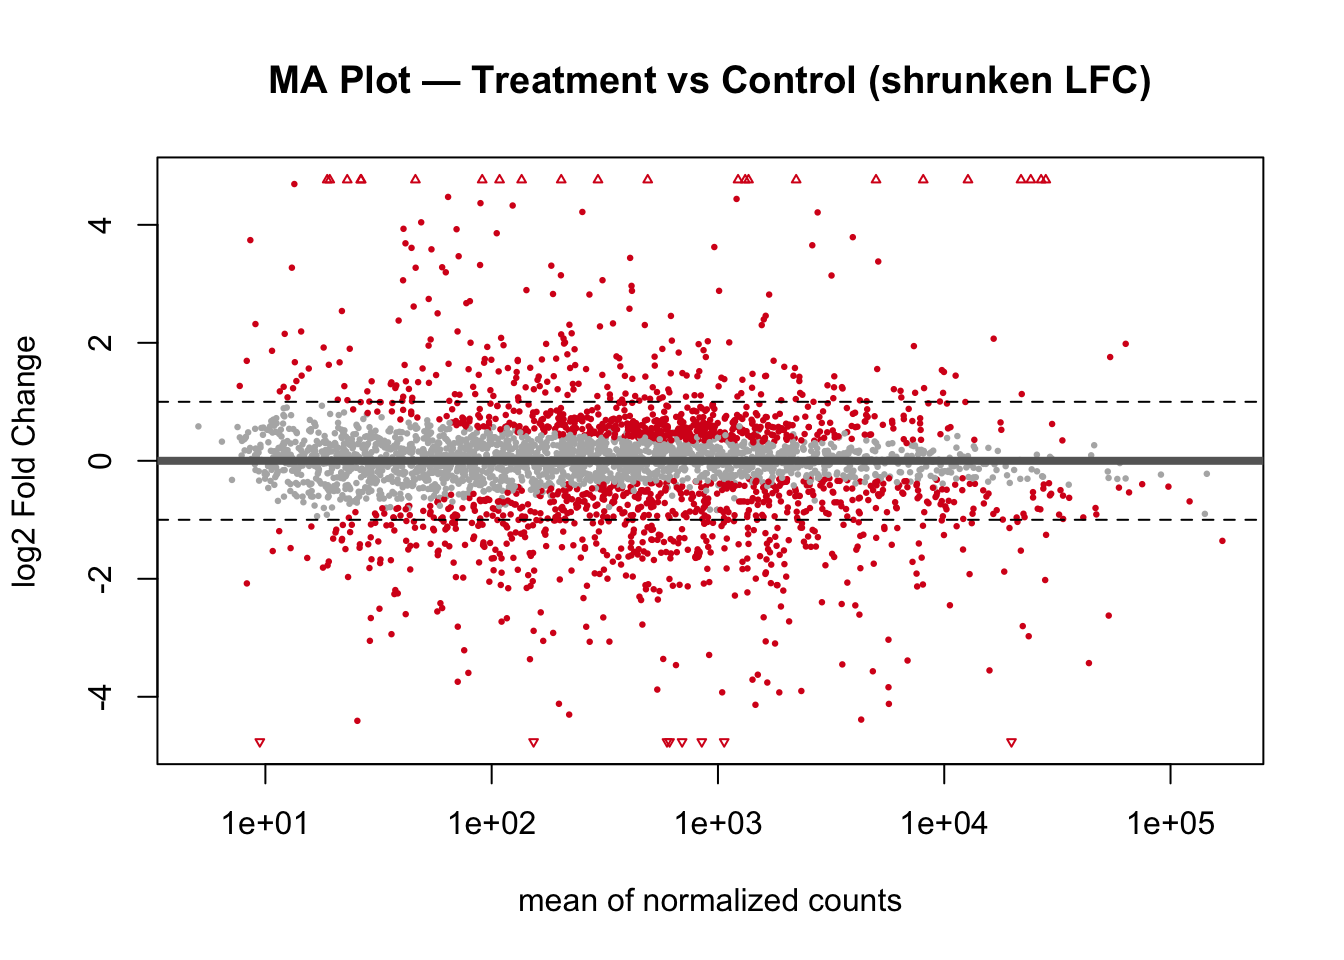
An MA plot shows log2 fold change (y-axis) against mean expression (x-axis). It helps assess whether the fold change estimates are stable across the expression range. After shrinkage, estimates for lowly expressed genes (left side) should be pulled toward zero.
plotMA(res_shrunk,
       alpha = 0.05,
       main  = "MA Plot — Treatment vs Control (shrunken LFC)",
       colSig = "#d7191c",
       colNonSig = "grey70",
       ylab  = "log2 Fold Change")
abline(h = c(-1, 1), lty = 2, col = "black")