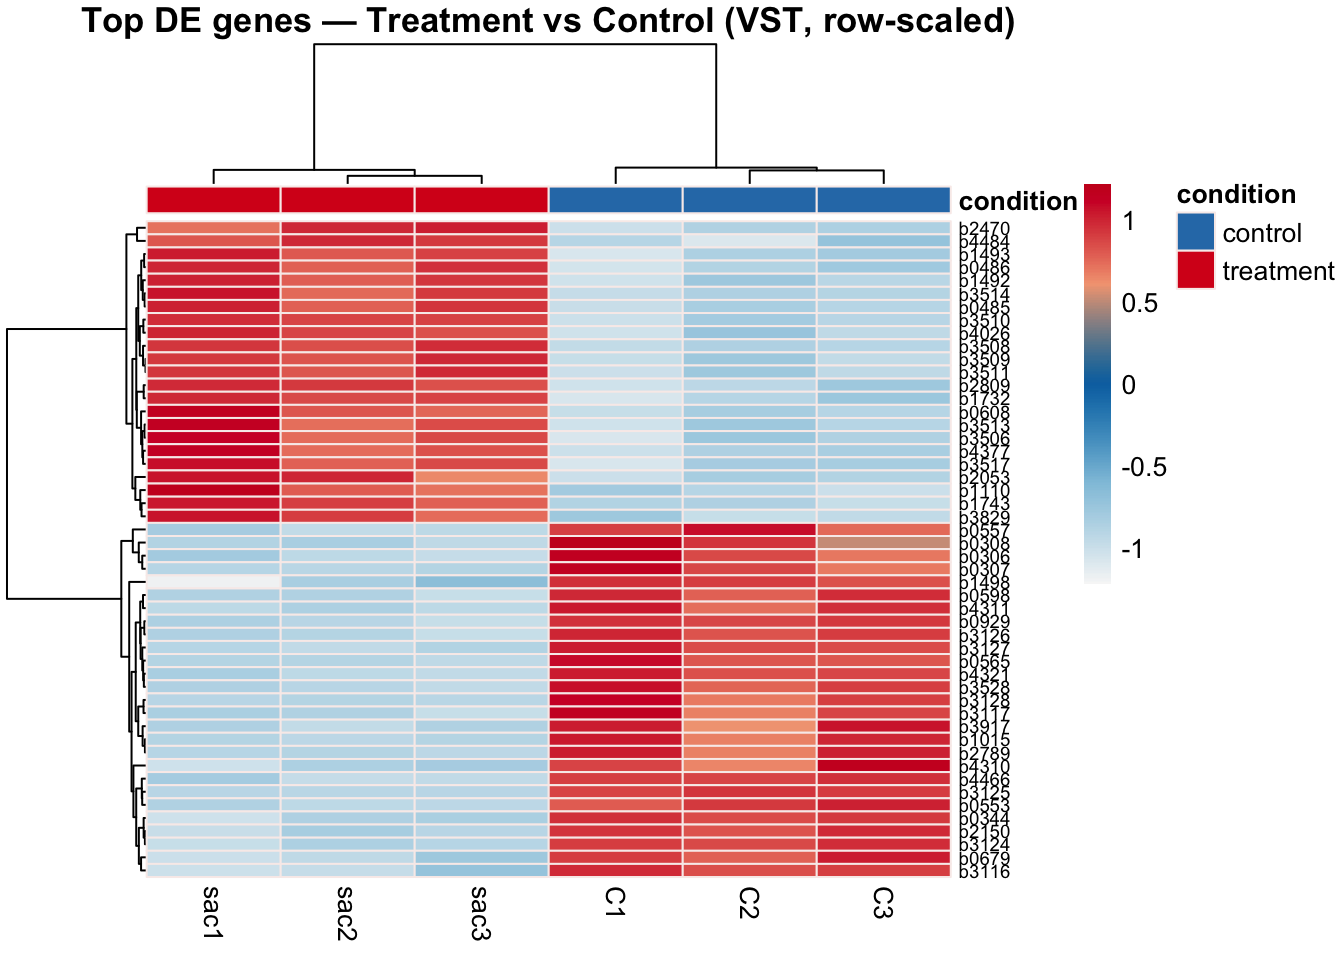
5.8 Heatmap of Significant Genes
Clustering significant DE genes across samples provides a gene-level view of the expression differences. Genes should show clear block structure: high expression in treatment and low in control (or vice versa). Replicates within each condition should cluster together.
vsd <- varianceStabilizingTransformation(dds, blind = FALSE)

sig_genes <- res_sig %>%
  slice_min(padj, n = min(50, nrow(res_sig))) %>%
  pull(gene)

df_anno    <- as.data.frame(colData(vsd)[, "condition", drop = FALSE])
anno_colors <- list(condition = cols_condition)
colsHeat   <- c("#F7F7F7", "#92C5DE", "#0571B0", "#F4A582", "#CA0020")

pheatmap(
  assay(vsd)[sig_genes, ],
  cluster_cols             = TRUE,
  cluster_rows             = TRUE,
  scale                    = "row",
  clustering_distance_rows = "euclidean",
  clustering_distance_cols = "euclidean",
  annotation_col           = df_anno,
  annotation_colors        = anno_colors,
  show_colnames            = TRUE,
  show_rownames            = TRUE,
  color                    = colorRampPalette(colsHeat)(255),
  border_color             = "#f8edeb",
  fontsize_row             = 7,
  main                     = "Top DE genes — Treatment vs Control (VST, row-scaled)"
)
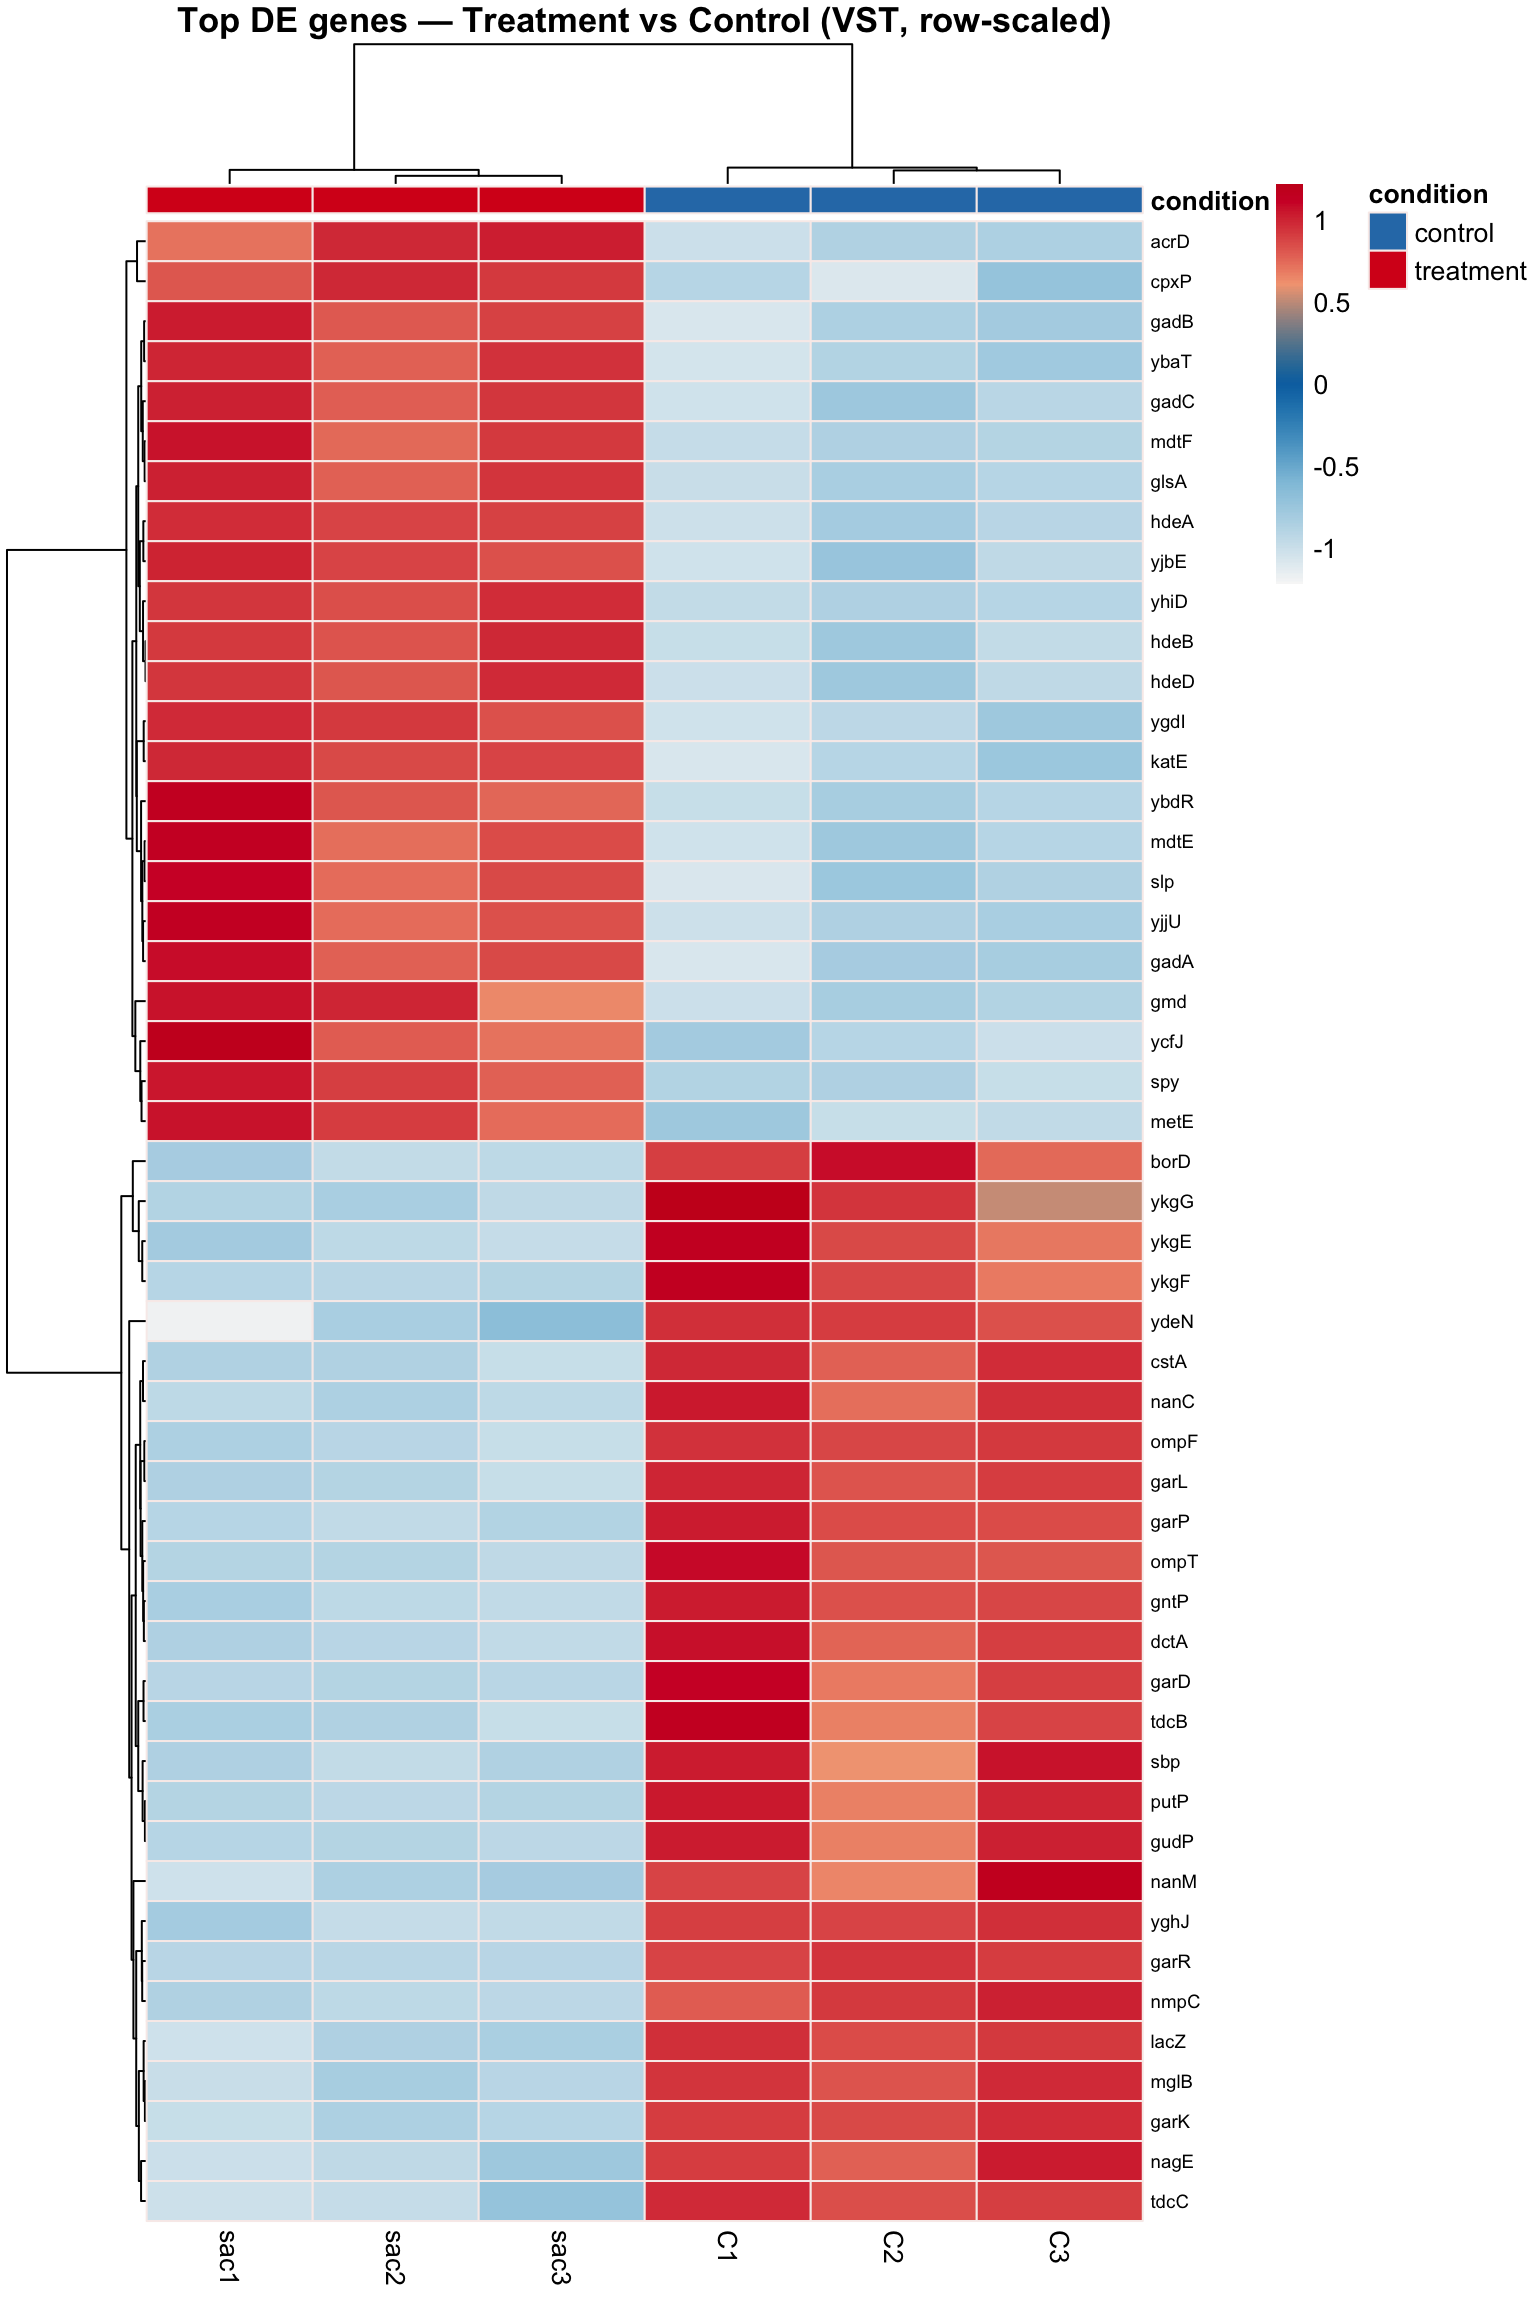
5.8.1 Add gene names
gtf_map <- readRDS(file.path(git_root, "results", "gtf_map.rds"))
vsd <- varianceStabilizingTransformation(dds, blind = FALSE)

sig_genes <- res_sig %>%
  slice_min(padj, n = min(50, nrow(res_sig))) %>%
  pull(gene)

# Replace locus tags with gene names for display
heat_mat   <- assay(vsd)[sig_genes, ]
row_labels <- gtf_map$label[match(rownames(heat_mat), gtf_map$locus_tag)]
rownames(heat_mat) <- ifelse(is.na(row_labels), rownames(heat_mat), row_labels)

df_anno     <- as.data.frame(colData(vsd)[, "condition", drop = FALSE])
anno_colors <- list(condition = cols_condition)
colsHeat    <- c("#F7F7F7", "#92C5DE", "#0571B0", "#F4A582", "#CA0020")

pheatmap(
  heat_mat,
  cluster_cols             = TRUE,
  cluster_rows             = TRUE,
  scale                    = "row",
  clustering_distance_rows = "euclidean",
  clustering_distance_cols = "euclidean",
  annotation_col           = df_anno,
  annotation_colors        = anno_colors,
  show_colnames            = TRUE,
  show_rownames            = TRUE,
  color                    = colorRampPalette(colsHeat)(255),
  border_color             = "#f8edeb",
  fontsize_row             = 7,
  main                     = "Top DE genes — Treatment vs Control (VST, row-scaled)"
)