4.6 Sanity Checks
📌 Remember: Always do a sanity check!
4.6.1 Are We Working with Raw Counts?
DESeq2 requires raw, un-normalised integer counts. Feeding it normalised values (TPM, FPKM) will produce incorrect results.
📌 Remember: Always verify your input before proceeding.
options(scipen = 999)


kable(count_genes[1:6, ],
      caption = "Raw count matrix — first 6 genes",
      format.args = list(big.mark = ",")) %>%
  kable_styling(bootstrap_options = c("striped", "hover", "condensed"),
full_width = FALSE)| C1 | C2 | C3 | sac1 | sac2 | sac3 | |
|---|---|---|---|---|---|---|
| b0001 | 0 | 0 | 1 | 1 | 0 | 0 |
| b0002 | 2,754 | 2,375 | 8,666 | 5,901 | 4,451 | 6,523 |
| b0003 | 1,085 | 899 | 4,300 | 1,882 | 1,410 | 2,199 |
| b0004 | 1,851 | 1,484 | 7,284 | 2,973 | 2,182 | 3,516 |
| b0005 | 4 | 4 | 3 | 15 | 9 | 5 |
| b0006 | 250 | 222 | 1,011 | 269 | 288 | 439 |
barplot(colSums(count_genes),
        main   = "Library sizes (total counts per sample)",
        ylab   = "Total raw counts",
        xlab   = NULL,
        col    = "steelblue",
        las    = 2,
        names.arg = colnames(count_genes))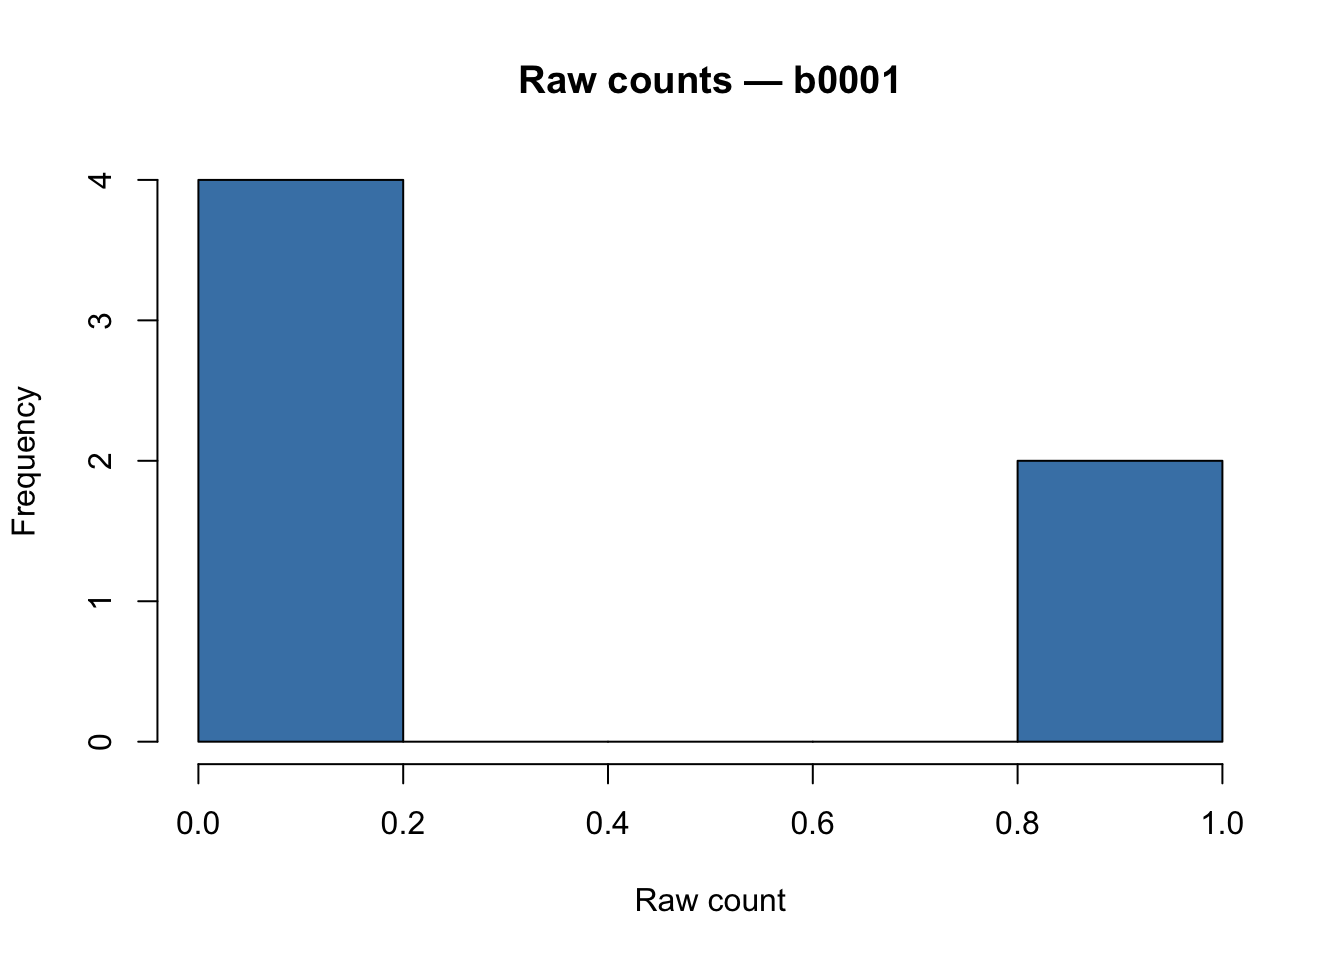
💡 Tip: scipen = 999 is a penalty against scientific notation. R uses it to decide when to switch between fixed (150000) and scientific (1.5e+05) format. The default is scipen = 0 — by setting it to 999 you make the penalty so high that R almost never switches to scientific notation, preferring plain numbers instead.
Raw E. coli RNA-seq counts are typically in the thousands to millions range (library sizes ~5–50 M reads for bacterial experiments).
A highly right-skewed distribution is expected and correct at this stage.
4.6.2 Pre-filtering Low-count Genes
Genes with very few counts across all samples carry no statistical power and inflate the multiple testing burden. We remove genes that do not have at least 10 counts in a minimum number of samples (equal to the size of the smallest group, i.e., 3 replicates here).
E. coli has ~4,300 genes — after filtering you should retain the majority of them.
smallestGroupSize <- min(table(samples_info$condition))

cat("Smallest group size   :", smallestGroupSize, "\n")
## Smallest group size : 3## Filtering threshold : at least 10 counts in 3 or more sampleskeep <- rowSums(counts(dds) >= 10) >= smallestGroupSize
dds <- dds[keep, ]
cat("Genes before filtering:", nrow(counts(dds)) + sum(!keep), "\n")## Genes before filtering: 4523## Genes after filtering: 3698## Genes removed : 8254.6.3 Factor Order and Reference Level
The first factor level is always the reference (denominator) in DESeq2 comparisons. Setting it explicitly ensures that fold changes are computed in the intended direction: treatment vs control, not the reverse.
## [1] "control" "treatment"📌 Remember: The reference level determines the direction of fold changes. A positive log2FC means higher expression in the treatment relative to control.