5.7 Top Gene Count Plot
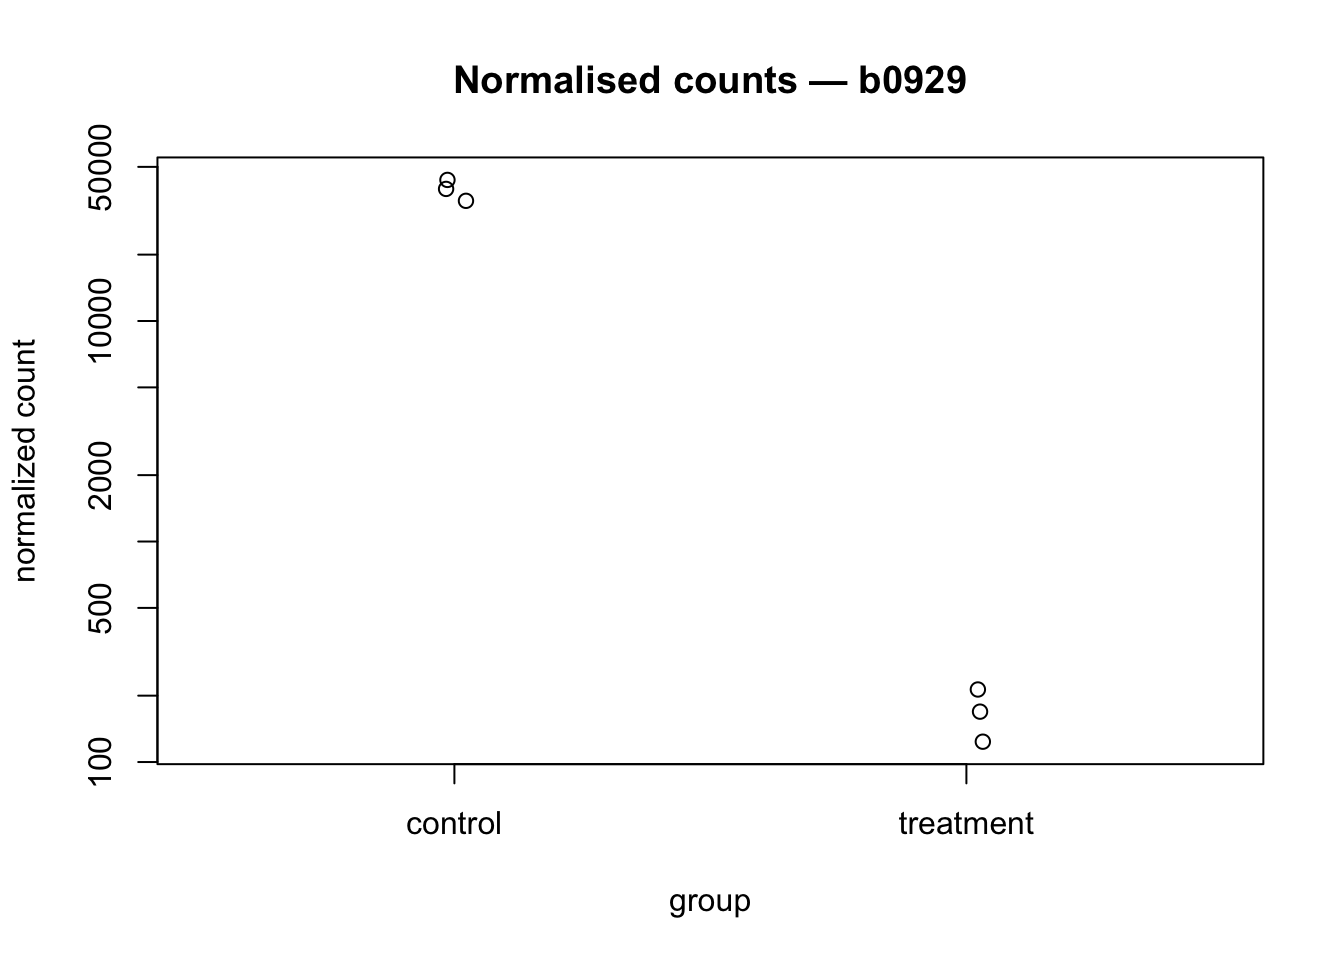
Plotting raw normalised counts for the most significant gene provides a sanity check: the direction and magnitude of the fold change should be visually obvious. If it isn’t, investigate further.
top_gene <- res_sig$gene[1]

plotCounts(dds,
           gene     = top_gene,
           intgroup = "condition",
           main     = paste("Normalised counts —", top_gene))