2.5 Coordinates - Plot geoms
Coordinates define how data values are mapped to positions on the plot.
The Cartesian system is the default (x–y axes), but ggplot2 also supports:
Map projections (for geographic data)
Polar coordinates (useful for circular plots)
You can also control the aspect ratio of a plot:
Use coord_fixed() to make one unit on x equal one unit on y.
This is helpful when comparing scales like city vs highway mpg so distances are proportional.
Example:
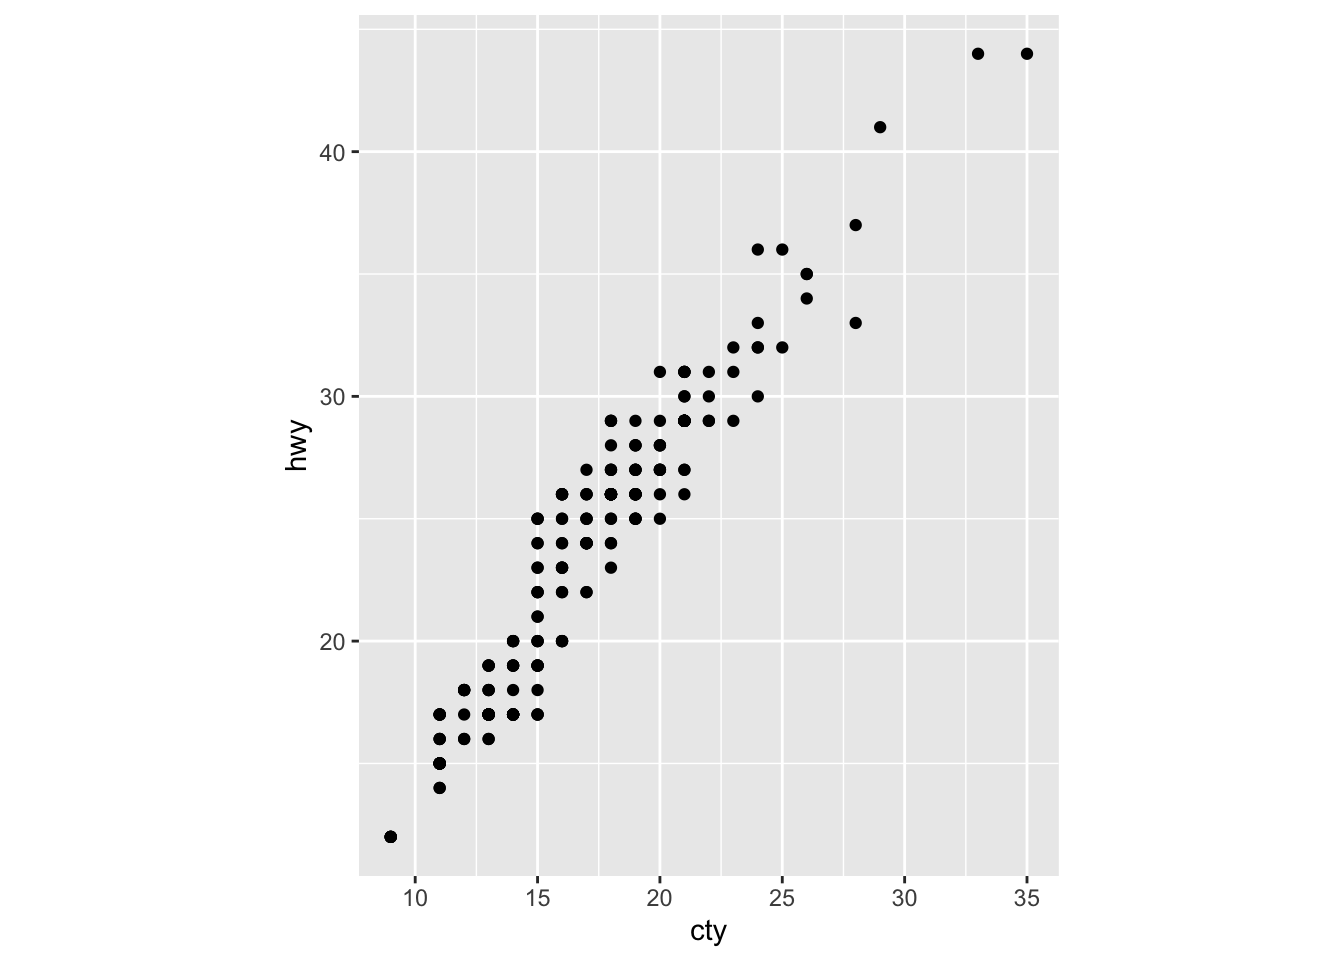
Now, a 45-degree line would correctly indicate equal city and highway mpg, which is easier to interpret visually.
Without coord_fixed(), the default plot might stretch one axis, misleading the viewer about relative differences.
❓ What would the plot look like if coord_fixed() was not used?, or changed to 90? Try it out!
📘 Note: Coordinates control how data values are positioned on the plot. coord_fixed() ensures that one unit on the x-axis is the same length as one unit on the y-axis, making comparisons easier and more accurate.