2.2 Labs
labs() in ggplot2
The labs() function sets or updates text labels in your plot, including the title, subtitle, caption, axis labels, and legend labels (for aesthetics like color, shape, or size).
Why it’s important: Clear and informative labels help the audience quickly understand what the plot shows, what each axis represents, and what the different colors or shapes mean. Well-labeled plots are easier to interpret and communicate your data effectively.
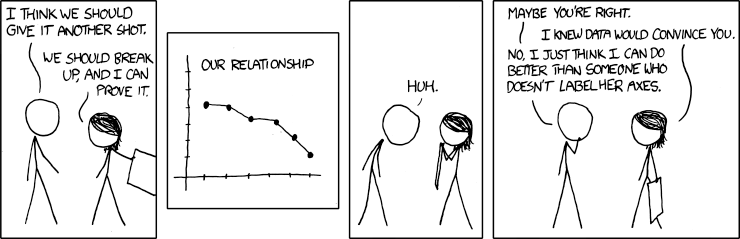
Figure 2.1: Credit: xkcd.com/833
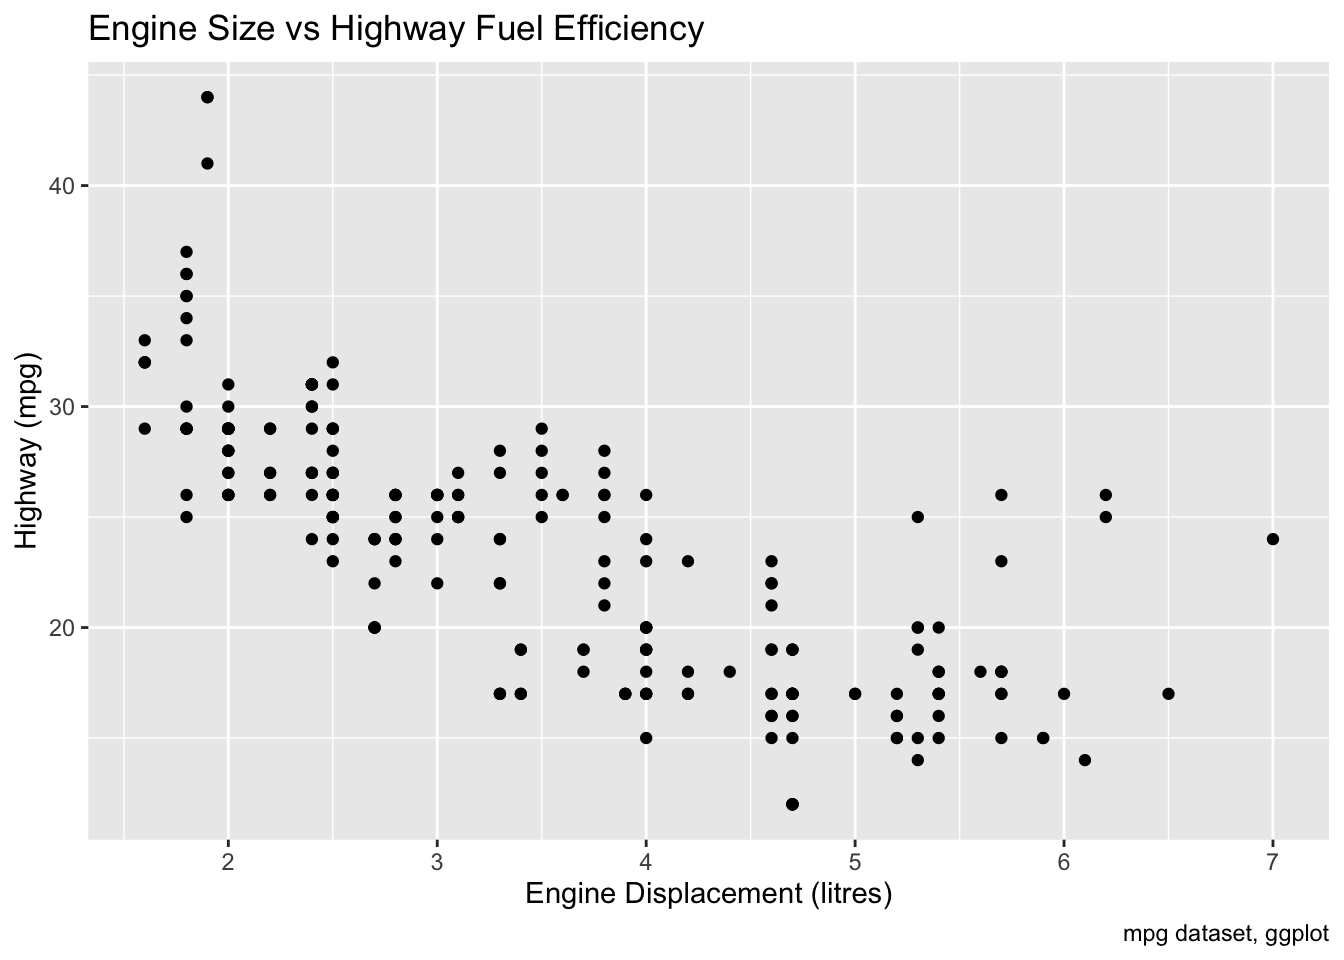
ggplot(mpg, aes(displ, hwy)) +
  geom_point() +
  labs(
    title = "Engine Size vs Highway Fuel Efficiency",
    x = "Engine Displacement (litres)",
    y = "Highway (mpg)",
    caption = "mpg dataset, ggplot"
  )