2.4 Facets
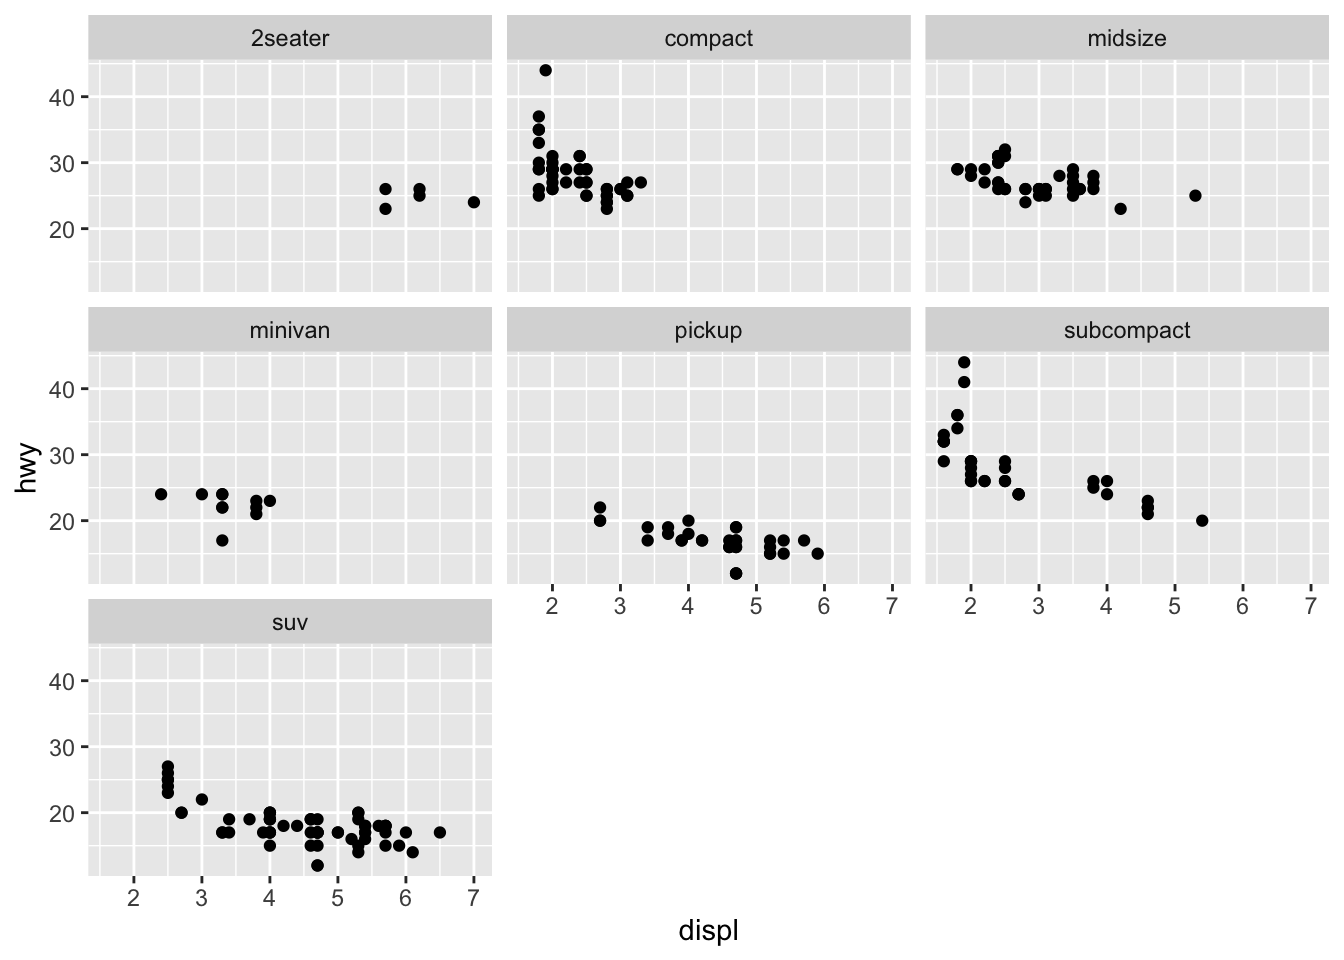
Facets can be used to separate small multiples, or different subsets of the data. It is a powerful tool to quickly split up the data into smaller panels, based on one or more variables, to display patterns or trends (or the lack thereof) within the subsets.
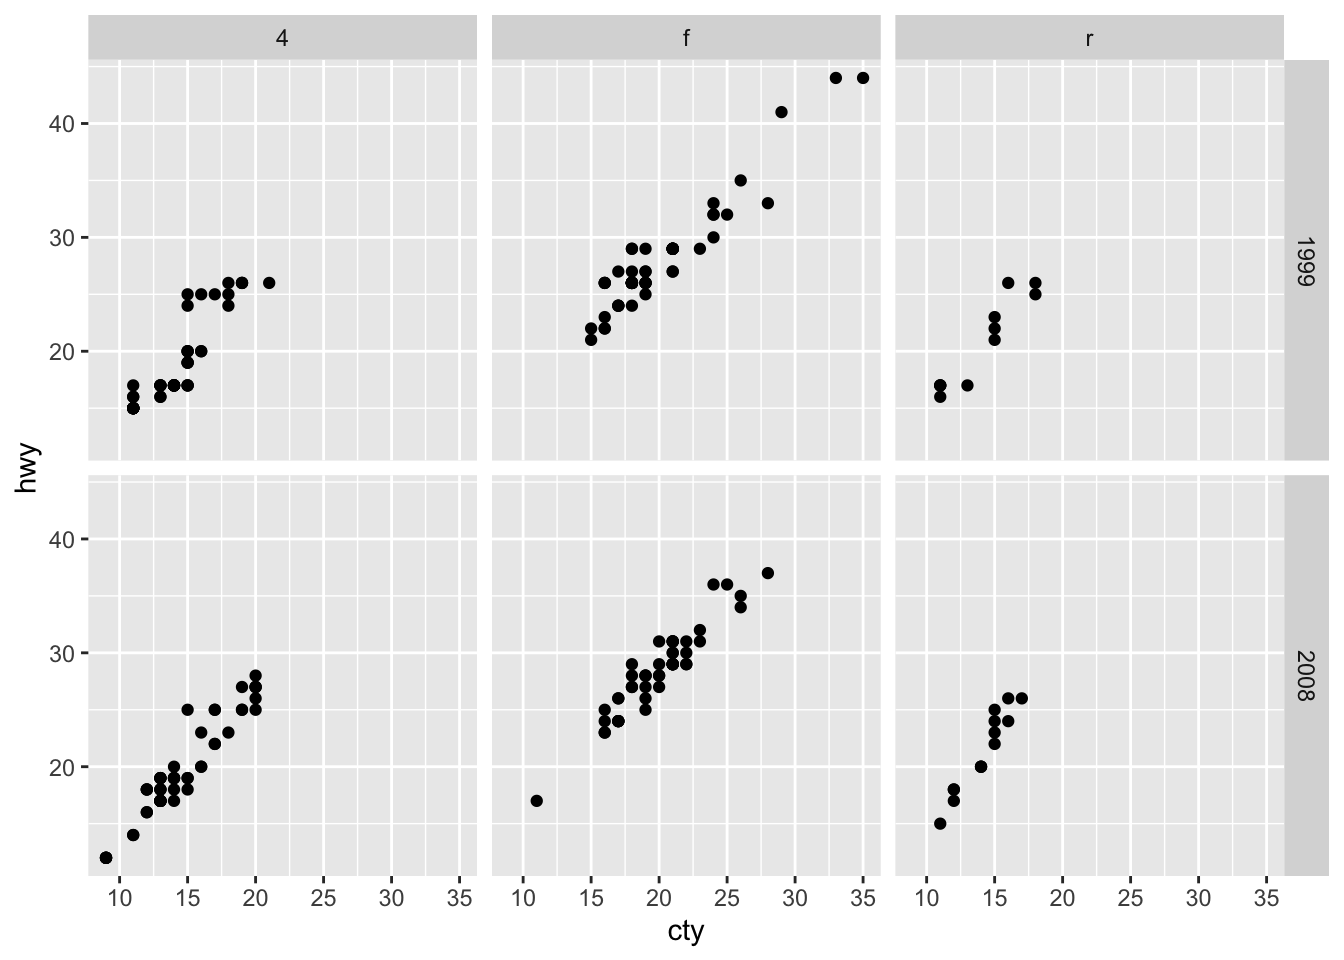
The facets have their own mapping that can be given as a formula. To plot subsets of the mpg dataset based on levels of the drv and year variables, we can use facet_grid() as follows:
You might wonder when to use faceting and when to use aesthetics.
You’ll learn more about the relative advantages and disadvantages of each in group-vs-facet
2.4.1 Exercises
What happens if you try to facet by a continuous variable like
hwy?What about
cyl?What’s the key difference?
Use faceting to explore the 3-way relationship between fuel economy, engine size, and number of cylinders.
How does faceting by number of cylinders change your assessement of the relationship between engine size and fuel economy?
Read the documentation for
facet_wrap().What arguments can you use to control how many rows and columns appear in the output?
What does the
scalesargument tofacet_wrap()do?When might you use it?