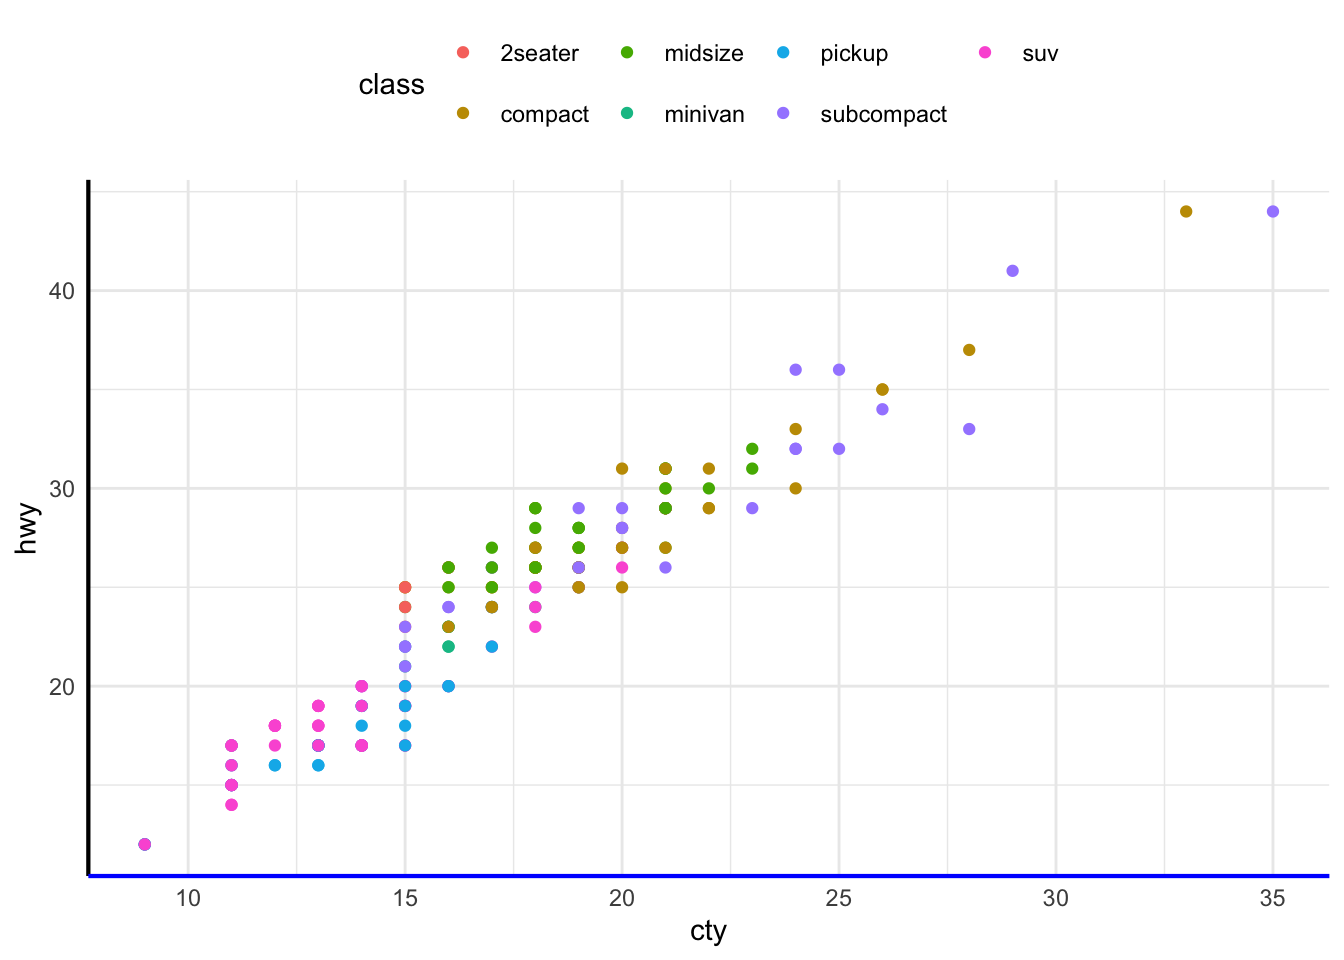
2.11 Theme
The theme system controls almost any visuals of the plot that are not controlled by the data and is therefore important for the look and feel of the plot. You can use the theme for customizations ranging from changing the location of the legends to setting the background color of the plot. Many elements in the theme are hierarchical in that setting the look of the general axis line affects those of the x and y axes simultaneously.
To tweak the look of the plot, one can use many of the built-in theme_() functions and/or detail specific aspects with the theme() function. The element_() functions control the graphical attributes of theme components.
ggplot(mpg, aes(cty, hwy, colour = class)) +
  geom_point() +
  theme_minimal() +
  theme(
    legend.position = "top",
    axis.line = element_line(linewidth = 0.75),
    axis.line.x.bottom = element_line(colour = "blue")
  )